
Whether you’re a business owner seeking to understand your company’s performance trends or an employee tasked with the presentation of data, having a firm grasp on the tools available can be key to communicating information as accurately and effectively as possible. Among the numerous chart types and data visualization tools at your disposal, a stacked chart can prove useful for a variety of business scenarios.
In this very article, we’ll delve into the purpose and utility of stacked charts in trade and business, along with an examination of when and how to deploy them effectively.
Understanding Stacked Charts
A stacked chart gives an illustration of different individual data elements that are procured collectively on the same chart. The grouping is done with each and every segment of the chart that represents a segment of complete data being illustrated.
These charts can effectively show the alterations over a specific time period for different categories simultaneously. It makes them an ideal tool in scenarios where showcasing the individual’s grouped performance and contributions based on diverse categories is quite productive.
The idea of stacked charts is not restrained to a specific volume of data. They are used to track different subjects, right from the data on sales across different product lines.
The shifts in the shared market are among the competitors over time to the segregation of a workforce and among the various departments. Whether the attention is on smaller datasets or the voluminous datasets with different categories, flexibility can simplify analysis and aims in the decision-making processes.
The Advantages of Stacked Charts
A stacked chart displays the composition of a whole by dividing it into segments, where each segment represents a category or sub-category. By stacking these segments together, businesses can easily compare and analyze the contribution of each category to the overall data set.
One advantage of using stacked charts is that they allow businesses to not only analyze individual categories but also evaluate their relative proportions. This is particularly useful when comparing data over time or monitoring the performance of different departments or products. For example, a stacked chart can be used to show the revenue generated by different product lines in a given period, enabling a quick assessment of which products are contributing the most to the overall sales.
Additionally, stacked charts provide a clear and intuitive visualization of the cumulative total. By showing the accumulation of each category or sub-category, businesses can easily identify trends, patterns, or imbalances in the data. This can be valuable for data-driven decision-making, such as allocating resources or identifying areas that require improvement.
Related: Unlocking The Power Of Data: How Insurance Companies Can Improve Customer Intelligence
Structuring Stacked Chart
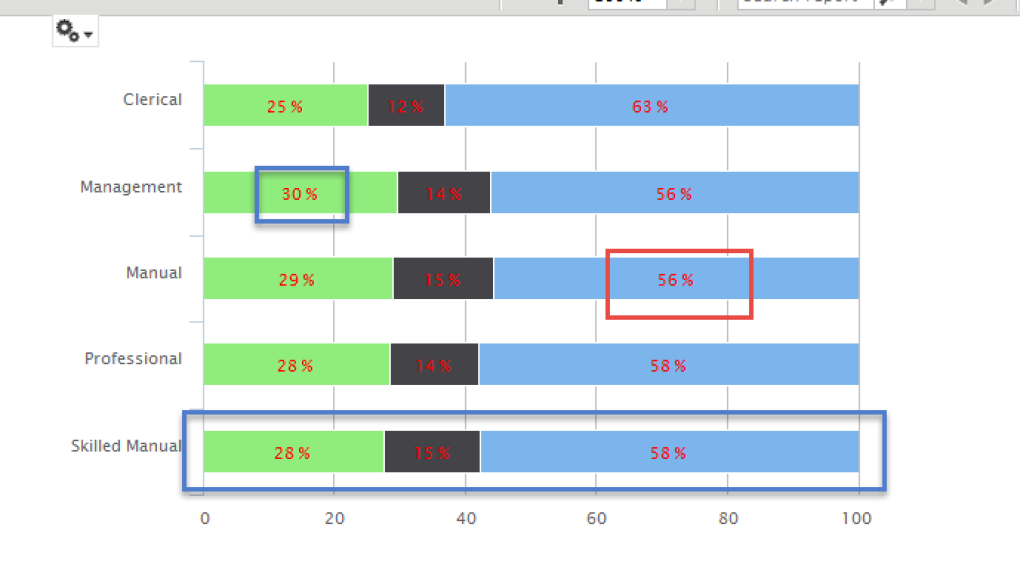
An effective stacked chart is not just about selecting the right data set but also about structuring it in a way that enhances clarity. There are two primary types of stacked charts – the regular stacked chart and the 100% stacked chart, which highlight different aspects of the data.
In a regular stacked chart, the height or length of each segment is determined by its value, allowing a focus on absolute values. These charts are effective when contrasting the total amounts across categories. Conversely, a 100% stacked chart visualizes the relative percentage that each component contributes to the total for each category. This is useful when the primary focus is the distribution and relational differences of components rather than their absolute values.
Ensuring you have chosen the right structure for your stacked chart and conveying this choice clearly to your audience can improve their understanding of the data being presented.
Designing Stacked Charts for Clarity
While presenting accurate data is important, so is ensuring that your stacked chart is designed for clarity. The use of colors can have a significant impact on the readability and interpretation of your data. Each category within your chart should have a clearly distinguishable color, enhancing visual differentiation. However, bear in mind that excessive use of bright or dark colors can be fatiguing to the eye.
Furthermore, labeling is crucial when it comes to stacked charts. Stacked charts are at their most effective when viewers can readily identify what each segment represents. Ensure that each segment is clearly labeled, either directly on the chart or through a legend that is easy to read and understand. The key is to design your chart in such a way that it is not just accurate but also easy to interpret and understand.
Conclusion
Overall, the utility of stacked charts in the field of business is undeniable. From presenting comprehensive sales data to highlighting trends in staffing levels, these simple yet effective data visualization tools can turn complex information into easily understandable, compelling visuals. The key remains knowing when, why, and most importantly, how to use them for maximum efficacy.
Read Also: